Investing in CHOPPY WATERS
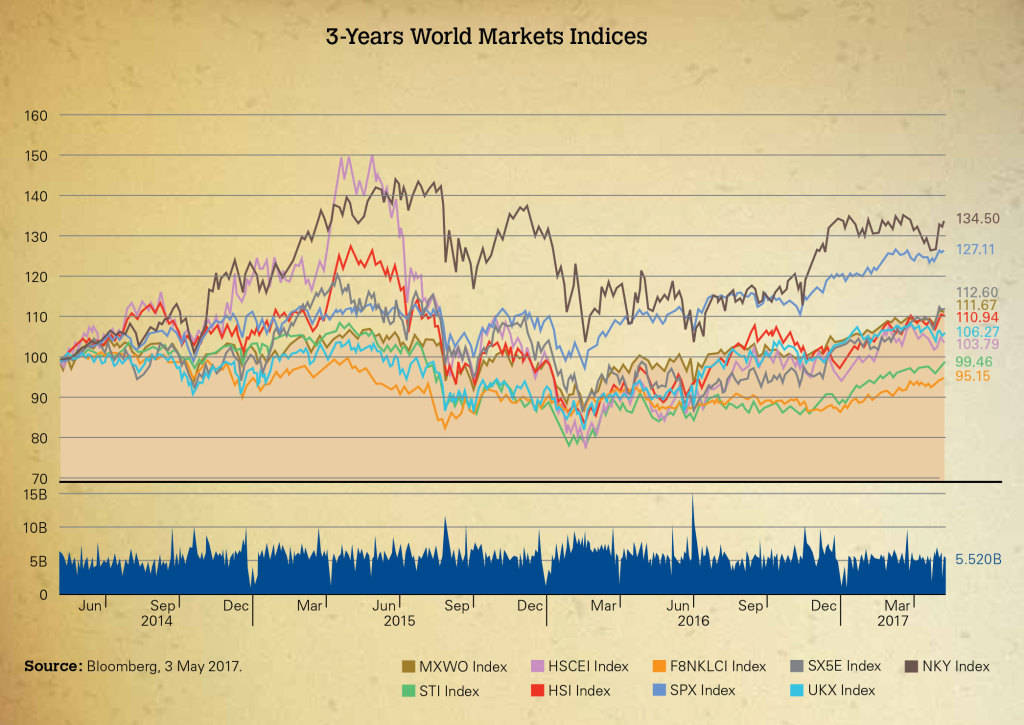
As investors, we are always hoping for a bull run. But the reality these days is that investing can be a constant up and down affair where volatility is very much part and parcel of investing. As can be seen from the graph below, markets globally have been challenged with increased volatility.
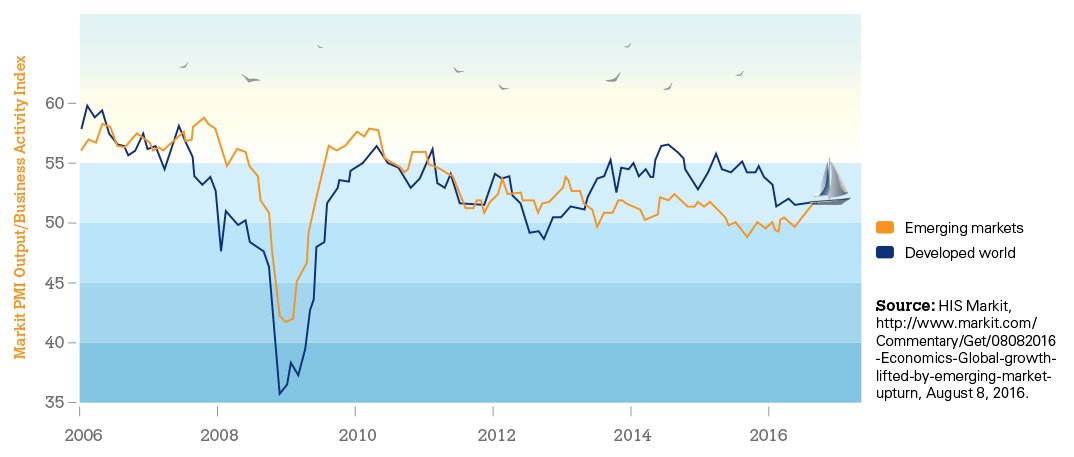
Developed Markets vs. Emerging Markets
Performance of Manufacturing Index
 LIKE THIS ARTICLE?
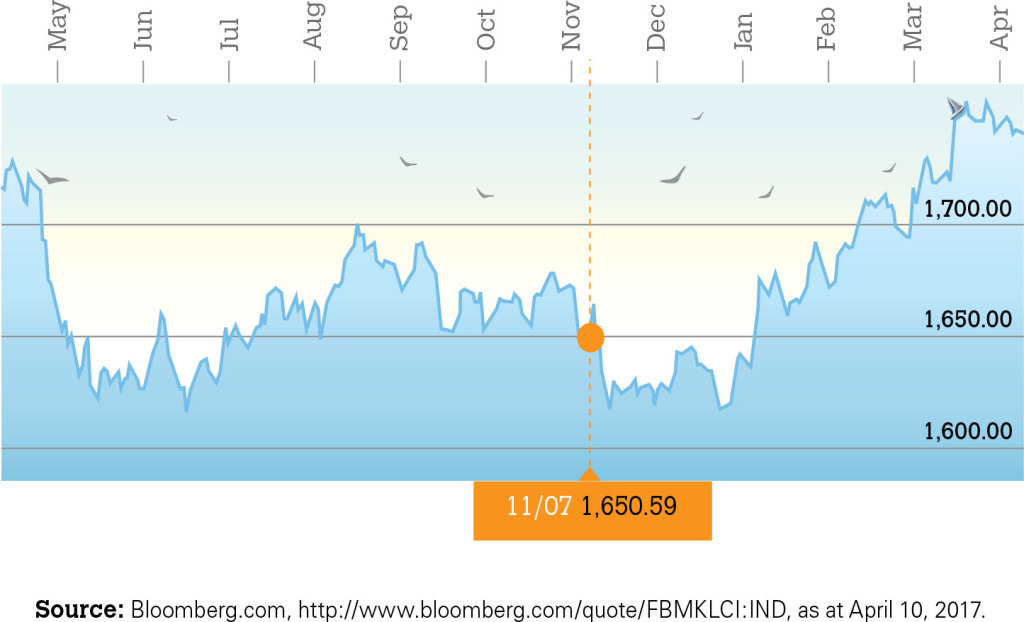
A look at the global performance of manufacturing index above also shows that not everyone is performing the same with developed markets and emerging markets not necessarily marching to the same beat. The Malaysian stock market has also experienced increased volatility in recent times as indicated in the graph below. Instead of being worried about how to deal with the choppy investment waters, it’s better to be prepared. A sound investment plan tailored to your goals and financial plans can help you better navigate the choppy market conditions.
Bursa Malaysia Kuala Lumpur Composite Index Performance
for the period 11 April 2016 – 10 April 2017
While no strategy can fully insulate you from market volatility or decline, there are investment strategies that could help you stay on the path of your goals. These are:

Asset Allocation & Diversification

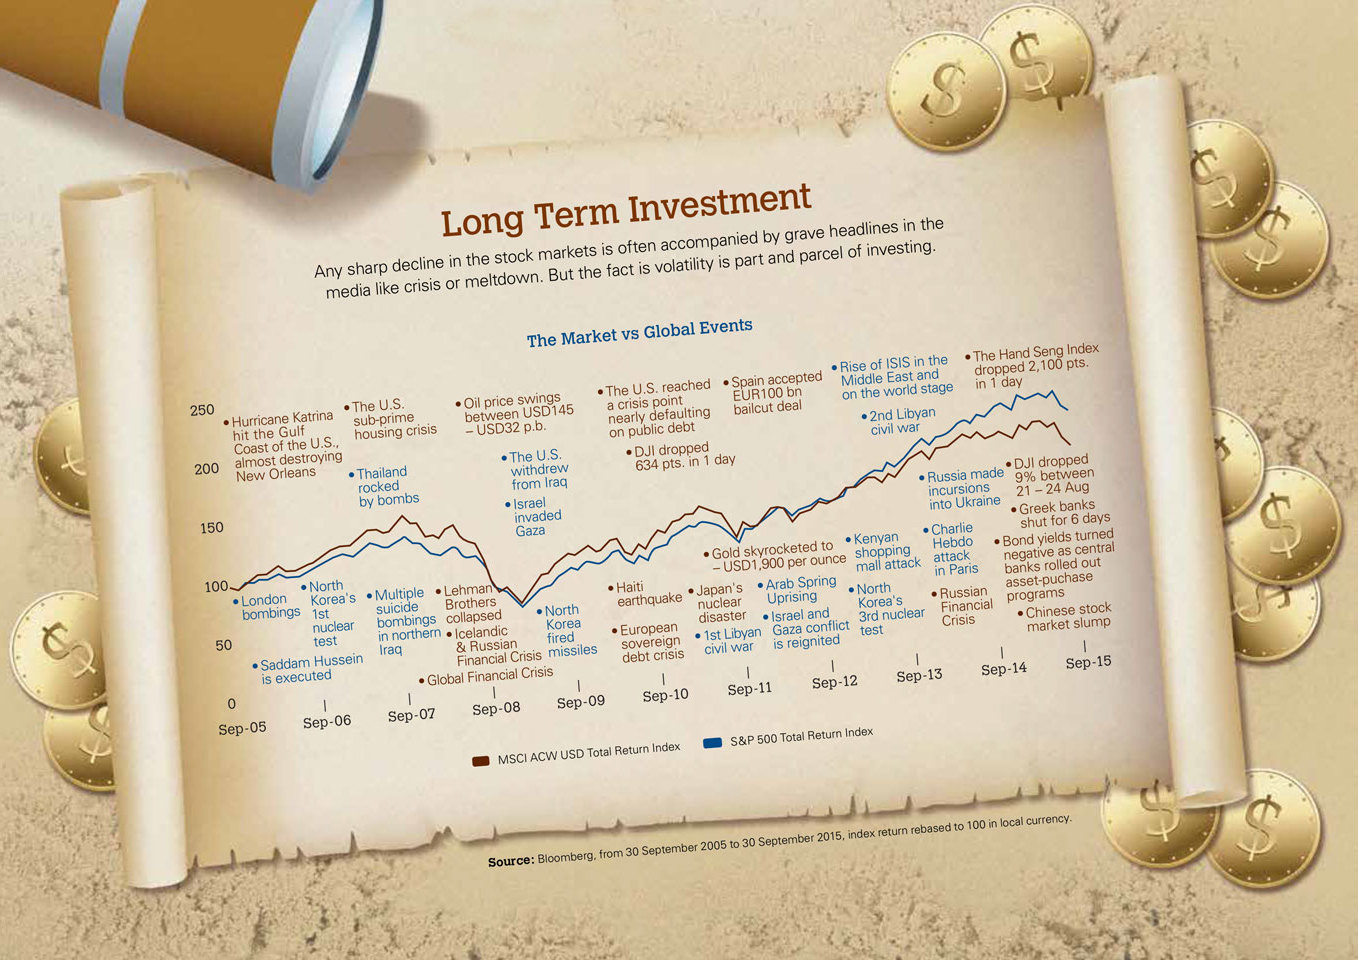
Long Term Investment

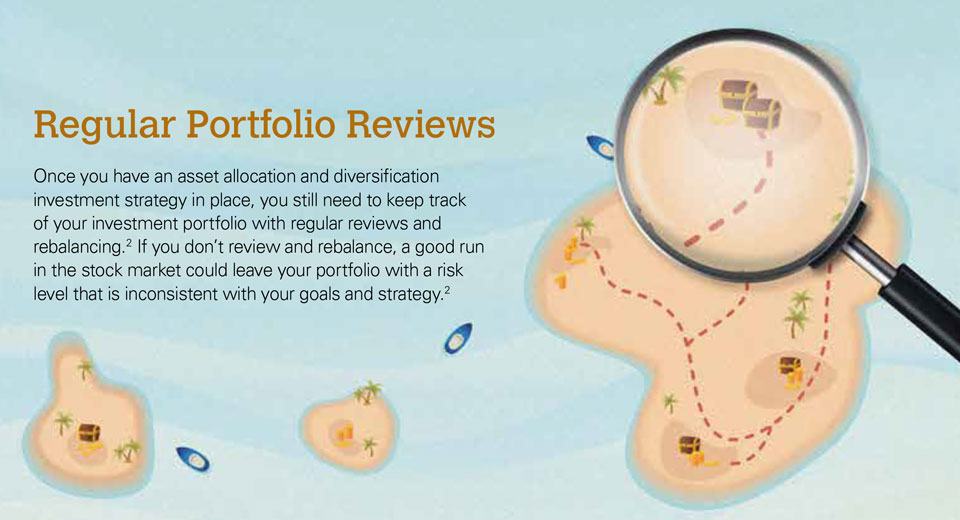
Regular Portfolio Reviews
Asset Allocation & Diversification

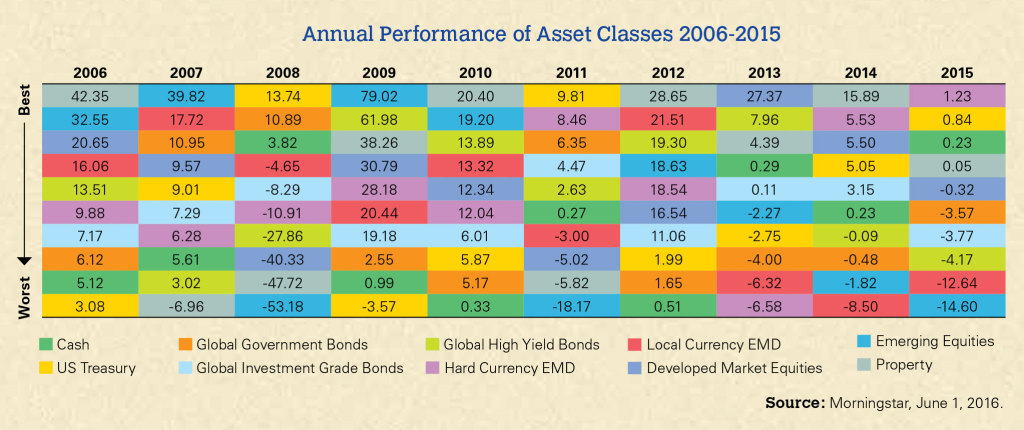
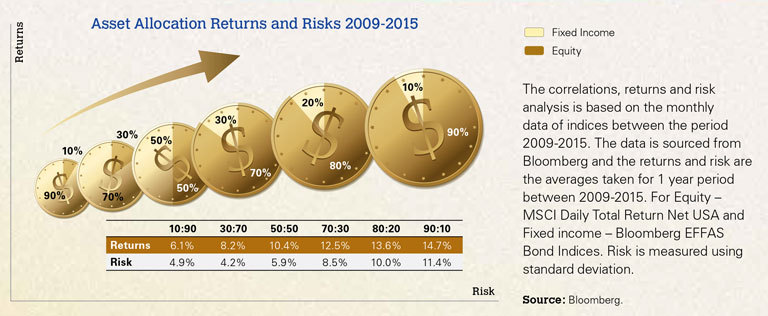
| Diversification is a key principle in investing, and it refers to the practice of spreading your investments among the different asset classes like stocks, bonds and cash.1 These broad asset classes can be further diversified – for example, your stock portfolio should include large and small company stocks as well as local and international stocks.1 Asset allocation is your portfolio’s asset mix which could include equities or equity funds – which are more volatile in the short term but have higher potential long term returns – and bonds or bond funds – which offer stability but relatively lower long term returns.1 The goal of a strategic asset allocation would be to choose a portfolio mix that will maximise your returns at a risk level at which you are comfortable or commonly referred to as your “risk tolerance”.1 | Why is asset allocation and diversification important? Each asset class performs differently as market and economic conditions change, and there is no way to predict which one will perform best. Different asset classes have different risk-return characteristics and chasing momentum in certain assets is prone to significant risks. Over concentration in an asset could also lead to large losses, particularly if that asset performs poorly. The following chart shows how the returns and ranking of each asset class have varied tremendously over the past 10 years, and how a diversified portfolio will have more stable returns by reducing the exposure to any one asset class. Ultimately a well-diversified portfolio helps mitigate risks.2 |
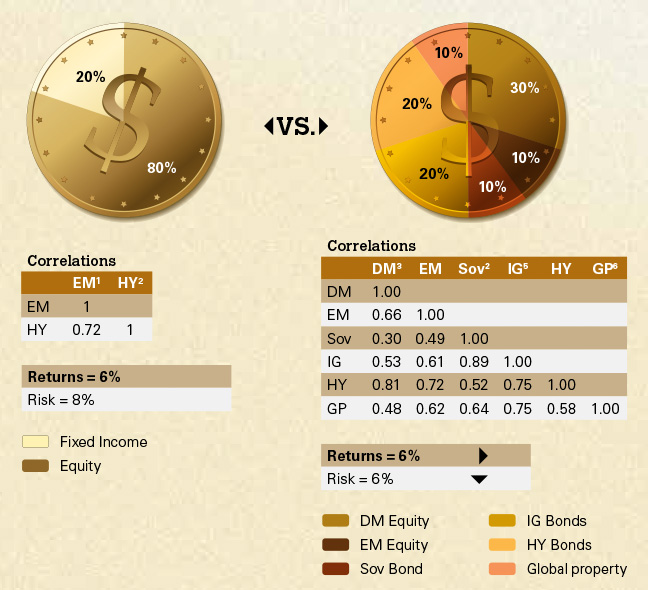
| Rather than trying to select a particular asset to outperform the market, which can be very difficult because different market cap stocks and sectors perform differently in various cycles and most unit trusts do not outperform or perform consistently, another option would be choosing an optimal diversified asset mix to enhance a portfolio’s performance. Divergent assets help build optimal portfolios for different goals. Your individual risk profile or risk tolerance and financial goals as an investor would form part of the basis of picking the most suitable portfolio.2 One of the values of diversification lies in the correlation between asset classes.2 By including assets of different risk-return profiles, some fluctuations in your portfolio can be cancelled out and may help reduce risk.2 Assets which are not perfectly correlated may add value to your portfolio by lowering the risk of asset concentration.2 | |
|
Asset Allocation Correlations |
|
 |
|
| Notes: 1 Emerging Market Equity (EM). 2 Global High Yield (HY). 3 Developed Market Equity (DM). 4 Global Sovereign Bond (Sov). 5 Investment Grade Bonds (IG). 6 Global Property (GP).The correlations, returns and risk analysis is based on the monthly data of indices between the period 2010-2015. The data is sourced from Bloomberg – MSCI Daily Total Return Net AC World, MSCI Daily Total Return Net GEM, Bloomberg Global Developed Sovereign Bond index, Bloomberg Global Investment Grade Corporate Bond index, Bloomberg Global High Yield Corporate Bond index, FTSE EPRA/NAREIT Global Total Return. Risk is measured using standard deviation. |
Bear Markets Generally Occur Every 4 to 5 Years
S&P 500 peak-to-trough or trough-to-peak price returns (February 1966-September 2015)
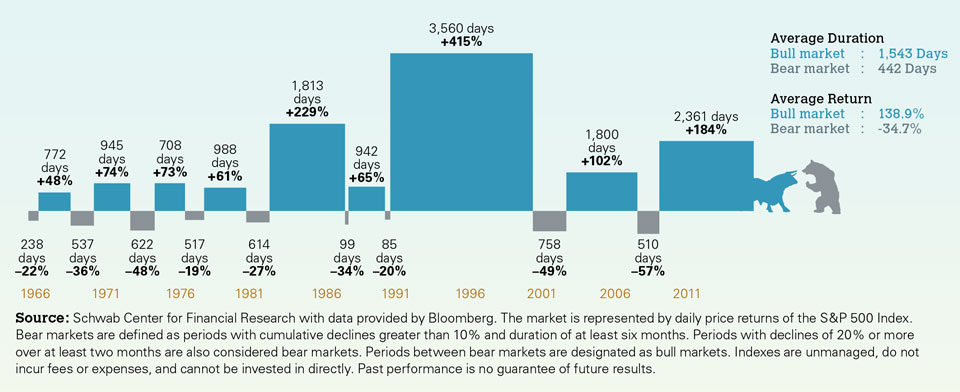
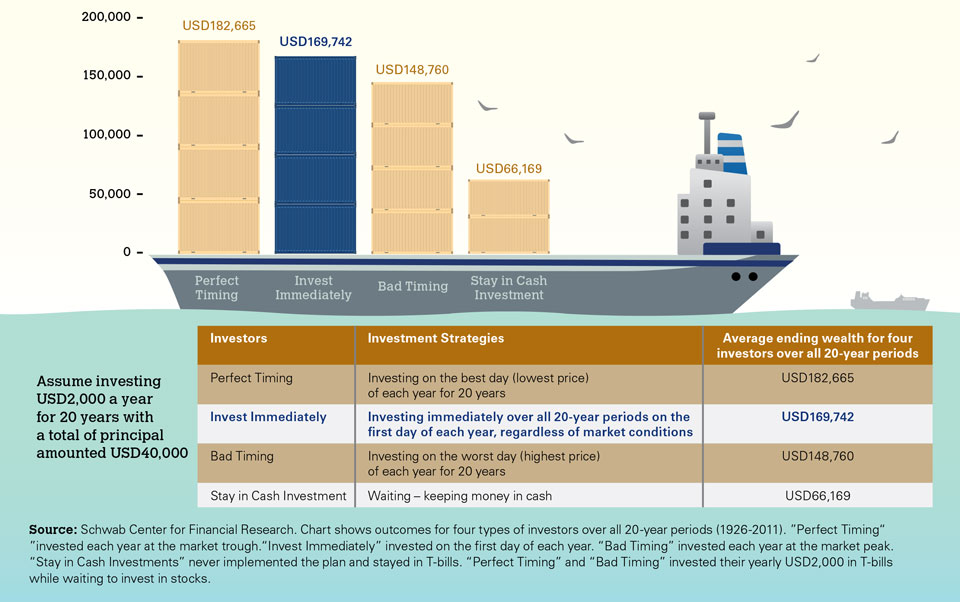
| A look at the chart which represents the performances of the MSCI ACW USD Total Return Index and the S&P 500 Total Return Index from September 2005 – September 2015 shows that fluctuations caused by major global events are simply par for the course.3 What’s important to note is that each market decline has been followed by even greater recovery and that staying invested in the long term may help reduce the volatility of performance in your portfolio.3 | Meanwhile, if you track the S&P 500 over the past 50 years based on the chart above, you will see that bear markets normally occur every four to five years. The chart shows that the average bull market return and duration is better and longer compared to the bear market preceding it. Below is a hypothetical 20-year investment. Whether it was made under poor or perfect market conditions, it still performed better than just saving in cash investments. | What all the data point to is that every time the stock market went through a slump, it eventually retraced its losses and went on to post new highs. Simply put, the markets move in short term cycles but the long term trend is up.1 Despite the perception of doom and gloom, recessions end, businesses continue to operate, and economies and markets recover and grow.1 |
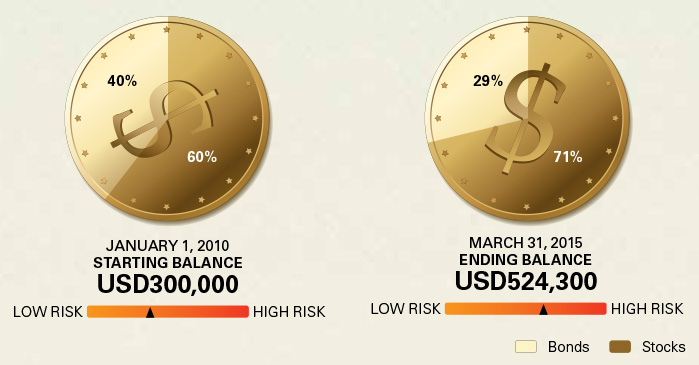
| In the following scenario below, for example, if the investor had rebalanced back to their 60/40 (stocks/bonds) allocation every year, they would have roughly the same amount – USD516,800 vs USD524,300 – but without the added risks that the more aggressive 70/30 allocation could potentially bring. | To help investors make informed investment decisions, HSBC has introduced a Portfolio Allocation Service – which is part of our needs-based investment approach – that offers a reference asset mix portfolio allocation that investors can use as a guide when conducting portfolio reviews. | To start, we will work together with you to help establish your financial goals, time horizons and assess your risk profile. Based on this information, we can use the Portfolio Allocation Service’s reference asset mix to match a suitable asset allocation and diversification strategy over the long term that is in-line with your risk profile. |
 |
| The indexes representing each asset class are the S&P 500” Index (large-cap stocks) and Barclays U.S. Aggregate Bond Index (bonds). Indexes do not include fees or expenses and cannot be invested in directly. The example is hypothetical and for illustrative purposes only. Dividends are assumed to have been reinvested. The example does not consider the effect of fees or taxes; if they had been considered, performance would have been lower. Historically, variation in returns ( one measure of risk) has increased with exposure to stocks. Source: Morningstar; Schwab Center for Financial Research. |
| Our Portfolio Allocation Service allows you to obtain assistance for your investments, while still maintaining control over your investment decision-making. Based on the reference asset mix that matches your circumstances, you could choose to invest in products offered by HSBC covering asset classes and international markets to support your asset allocation and diversification strategy. Research conducted by Dalbar, a US-based financial services market research firm, Quantitative Analysis of Investor Behavior in 2007, shows that investment returns increase when investors are disciplined, and that most investors need the support of a financial professional to provide this investment discipline.1 The firm concluded that investment return is far more dependent on investor behaviour than on fund performance.1 To find out more about making informed investment decisions and how our Portfolio Allocation Service can help your long term investment goals, speak to your Relationship Manager today. |
| Sources: 1 Capitalplanning.net, Five Strategies for Dealing with Difficult Markets, undated. 2 Fidelity.com, The Pros’ Guide to Diversification, February 28, 2017. 3 HSBC Wealth Insights, Cash Optimisation: Big Start 2016, Q1 2016. |