Don’t let inflation erode the real value of your assets. Put in place a long-term investment strategy that optimises your cash and maximises your returns for the future.
Do you remember when you could still watch a movie for RM10 years ago? Movie tickets cost much more today, no thanks in part, to the effect of inflation. In economic terms, inflation refers to the tendency of prices for consumer items like goods, services and housing to gradually rise over time.1 Inflation could also affect the value of your savings.1 That’s why it’s important to understand inflation and manage its effects as you plan your long-term savings and investment strategy.1
Inflation and Diminishing Savings
Let’s say you deposited RM100 into a savings account that pays a 1% interest rate today. In one year, you will have RM101 in your account. During the same period, if inflation is 3.5% – using Malaysia’s January 2016 consumer price index as our inflation rate2– you would need to have RM103.50 to make up for the impact of higher prices. Since you will only have RM101 in your savings account, you have actually lost some purchasing power.
If your savings don’t grow as fast as the rise in prices caused by inflation , the effect would be as though you are losing money.1Whether you are steadily saving money with a goal in mind like funding your children’s university education and your retirement, or a retiree living on fixed savings, inflation can cut into your purchasing power over time.1 This could diminish the monetary amount of your children’s education fund and your retirement savings, or affect your standard of living in retirement.1
Safeguarding Your Savings Through Cash Optimisation
 LIKE THIS ARTICLE?
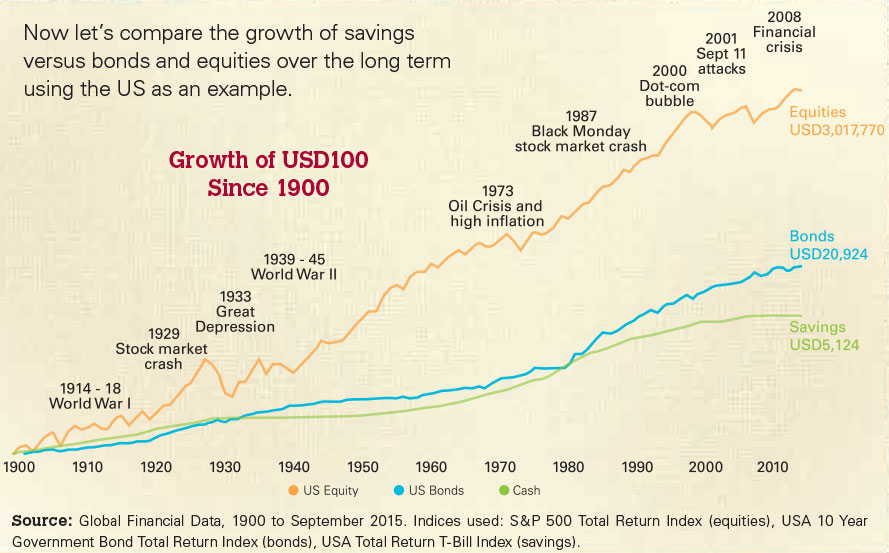
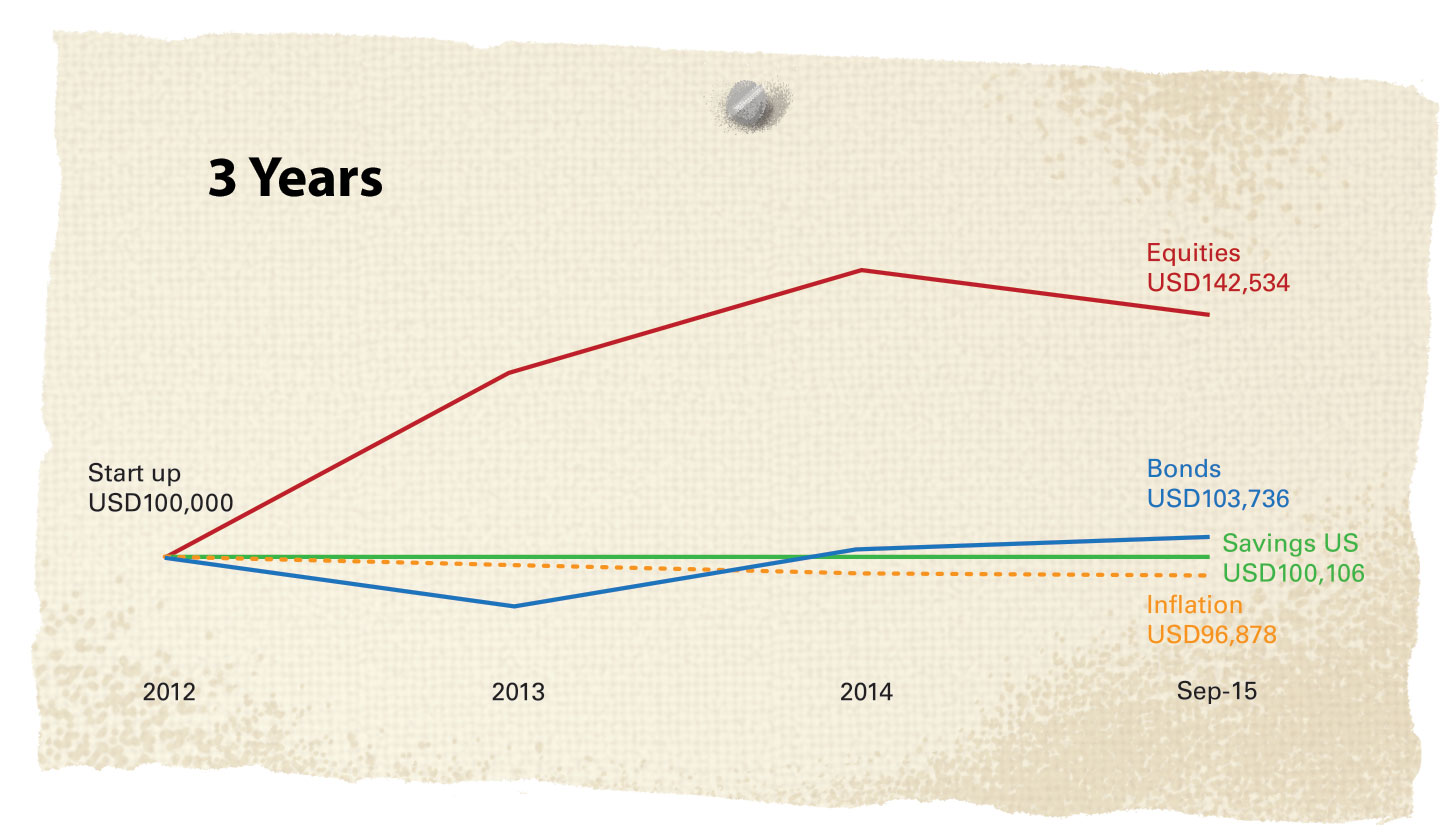
Even with market setbacks like the Great Depression in 1933, the stock market crash following “Black Monday” in 1987 and the GFC in 2008, significant recoveries have often followed these major setbacks.3 The data shows that staying invested in the equities market over the long term has historically paid off, more so compared to putting that same USD100 in bonds or savings.3 Now let’s look at shorter term data over 10-year (2005-2015), 5-year (2010-2015) and 3-year (2012-2015) periods.
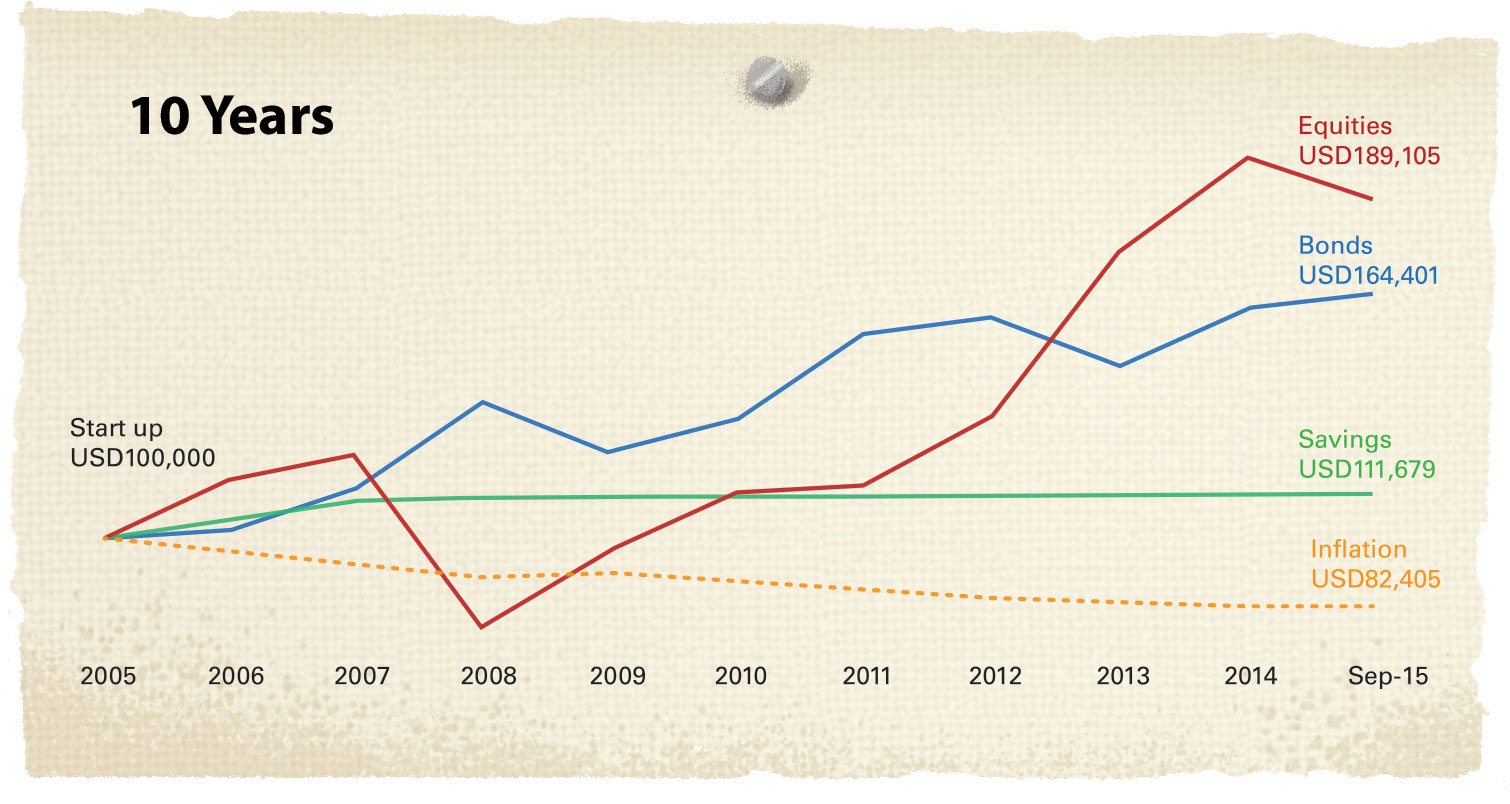
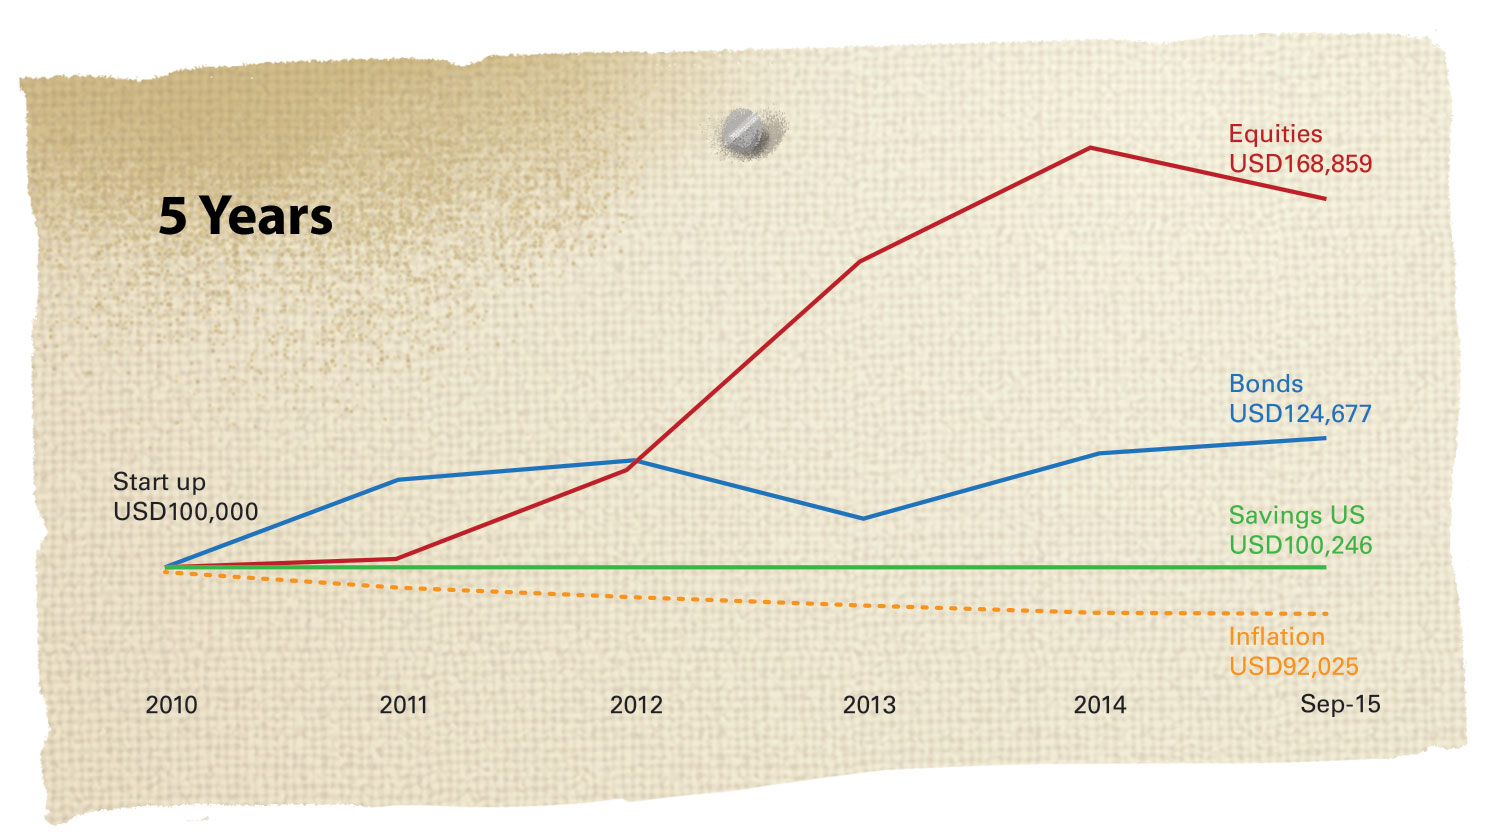
From all three charts, the trend of returns from equities, bonds and savings remain similar with equities offering the highest returns in each case and savings providing the least returns with a starting base of USD100,000. Even though risk assets like equities and bonds may be more volatile, the historical trend shows that investing in these assets provide better returns compared to cash savings over the long-term.3
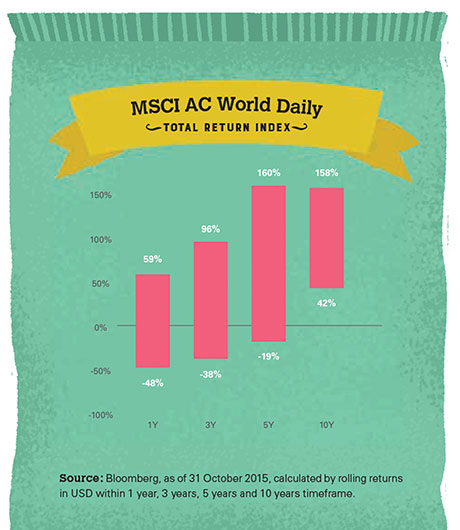
The MSCI AC World Daily Total Return Index shows that the longer your investment time frame, the less likely your investments will provide a negative return.3 Therefore, the longer you stay invested, the more likely you will enjoy positive returns.3
Opporunities Amidst Uncertainty
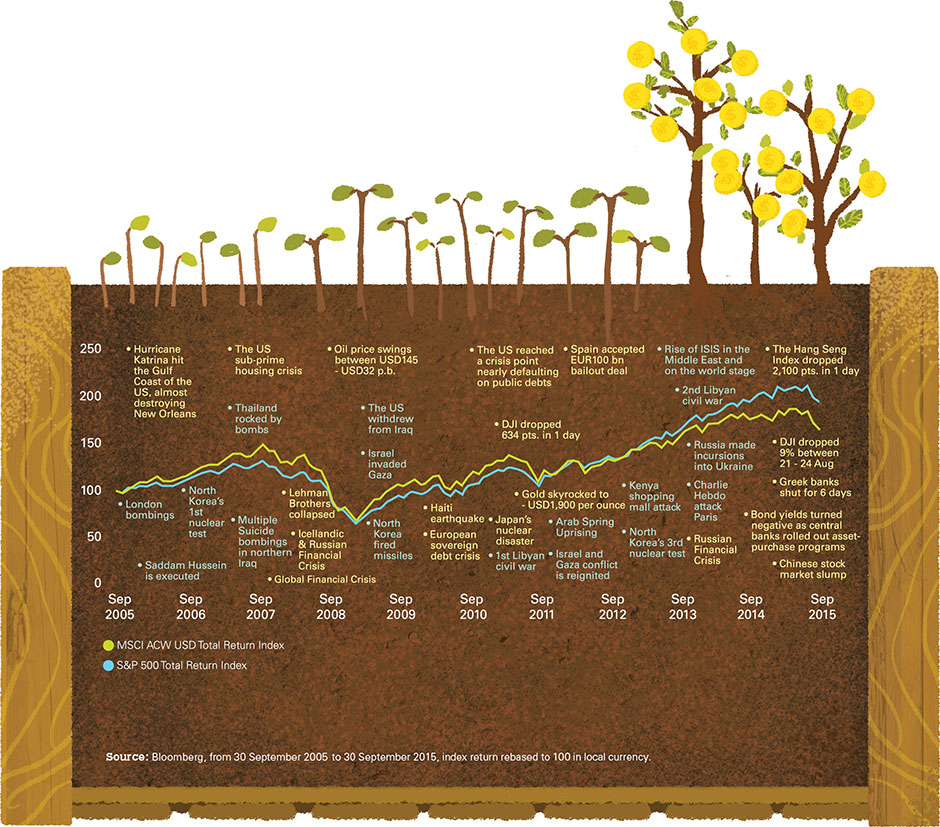
The Market vs. Global Events
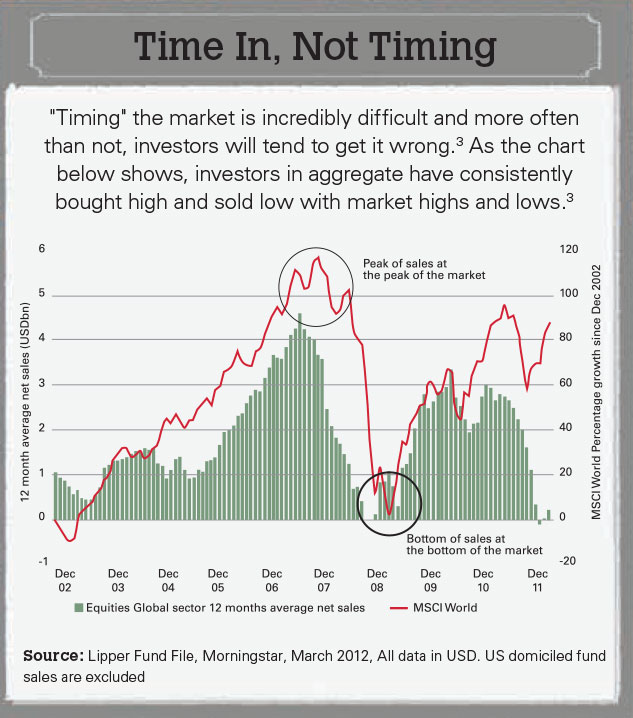
Rather than trying to time your investments, another option would be dollar-cost averaging – the regular deposit into a particular investment at regular intervals over a period of time. This method of investing can be a means of reducing the risk of investing during times of market volatility and might help avoid the pitfalls of attempting to “time” entry into investment markets.3
Source: HSBC Global Asset Management, Bloomberg, MSCI Daily Total Return Gross World Index, as at 30 September 2015.
Don’t Miss Out
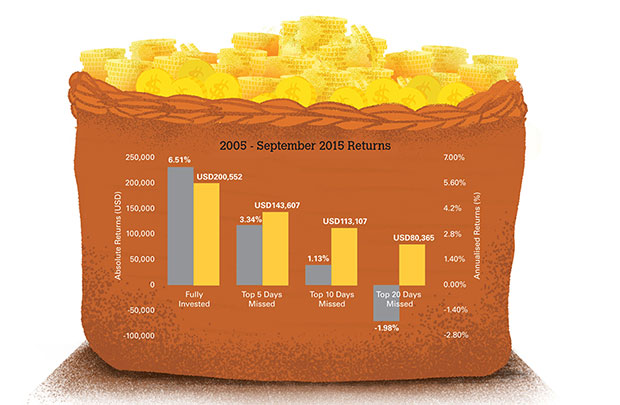
Missed opportunities can also be costly as illustrated by the chart on the top. Missing only a few of the best performing days in the market could lead to an adverse effect on the performance of your investment.3 Compare what happens to your return on investment if you were fully invested during that 10-year period on the left versus missing out on the top 20 days on the right; you would earn more than double in absolute returns by staying fully invested during that period.3
Developing an Investment Strategy
As the historical numbers show, simply sitting on cash can hardly make your assets grow.3 The worst case scenario, the real value of your assets may even be eroded by inflation overtime.3
With both global and local markets’ challenges over the past few years, and the fact that no one asset class can outperform all the time, it is important to have a long-term investment strategy. Utilising our newly introduced Portfolio Allocation Service, we can help you construct a diversified portfolio based on your risk level to make better investment decisions.
By following a structured and disciplined approach, our Portfolio Allocation Service can help you:
- Establish your financial goals/ time horizons
- Develop an asset allocation and international diversification strategy based on your risk appetite
- Decide how much to invest to help you achieve your goals
- Invest over the longer term to reduce volatility
- Understand your behavioral biases and how they can affect your investment success
- Review your financial portfolio regularly to keep up with market changes, risks and opportunities
• Sources: 1 Investopedia, How Inflation Affects Your Cash Savings, September 7, 2015. 2 The Malay Mail, Malaysia’s January Inflation Rate Rise to 3.5pc, Slightly Below Forecast, February 24, 2016. 3 HSBC Wealth Insights, Cash Optimisation: Big Start 2016, Q1 2016. 4 Australian Financial Review, The Joys of Dollar Cost Averaging, October 6, 2015.